Bill Data Completeness
The Bill Data Completeness Dashboard provides clients with real-time access to data completeness metrics for their utility bills, enabling them to monitor, manage, and act on data completeness across their entire portfolio and individual sites.
Bill Data Completeness Dashboard
-
Go to Data Management > Bill Data Completeness.
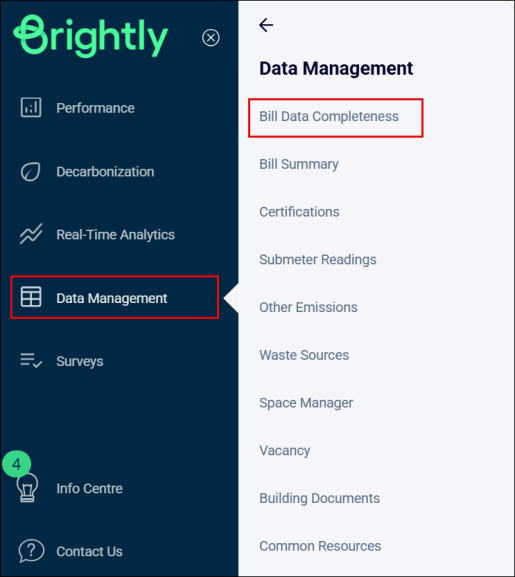
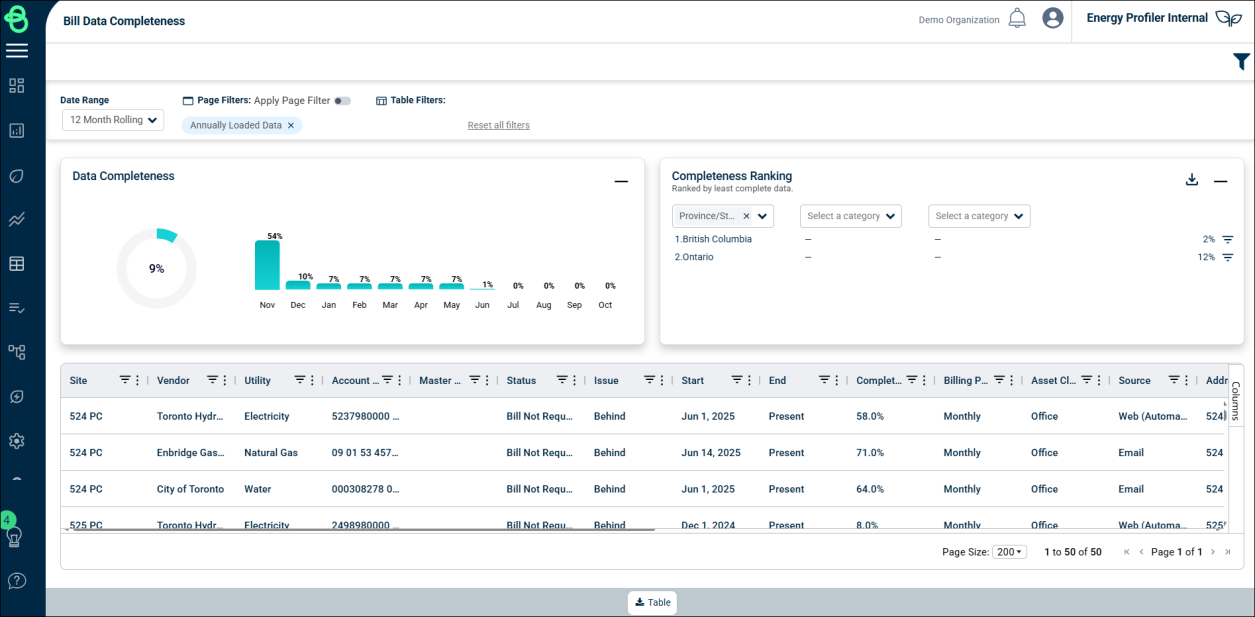
A Bill Data Completeness dashboard will appear.
Expected vs. Received Data
The Bill Data Completeness dashboard shows the percentage of billing data that Brightly has received and processed compared to what would typically be expected for each account. For example, in mid-August, Brightly might expect to have received the July bill for some accounts, while for others it may not be available yet.
This can occur if the vendor’s billing cycle is slower or if they issue bills bi-monthly. In such cases, the next bill may cover both July and August, and would not be issued until September.
Stream looks at the following factors to determine if a bill is expected or not:
-
End date of the previous bill
-
Billing Cycle (Monthly, Bi-Monthly, Quarterly)
-
Historical bill issue week. I.E. This account historically has been invoiced in the 2nd week of the month.
-
Processing time by data source. I.E. Billing data where Brightly has the log in credentials can be automatically downloaded and entered vs. accounts where bills need to processed client side and then a copy forwarded.
The dashboard includes the following sections:
-
Data Completeness – Monthly Breakdown
-
Completeness Ranking
-
Account Detail Table
Data Completeness – Monthly Breakdown
-
This section displays the bill completeness metrics.
-
Users can check the number of loaded and missing bills for each month.
-
Provides an overall percentage view of yearly bill completeness.
-
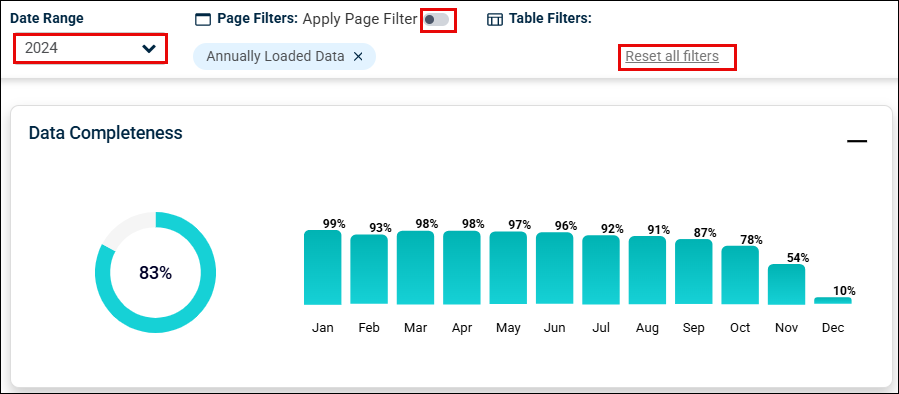
Users can select the year for which they want to view the bill completeness from the Date Range dropdown menu.
-
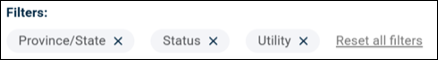
Users can clear filters by clicking the cross symbol or by clicking on the Reset all filters button.
Data Completeness – Page Filter Usage
Page filters are applied through the table and affect all elements on the page, including the charts. However, you can toggle this functionality on or off using the ‘Apply Page Filters’ toggle to control their application across the page.
Table Only Filters
Table-only filters are specific to the table itself and do not influence other elements on the page, such as charts.
Why is this distinction important?
Certain filters, like filtering for accounts with a ‘Gap’ in their data, are applied only to the table because applying them to charts such as ‘Data Completeness’ or ‘Completeness Rankings’ would produce meaningless results. For example, calculating “What percentage of a dataset is missing from accounts with missing data" would not provide actionable insights. By limiting these filters to the table, we ensure that data visualization remain coherent and meaningful.
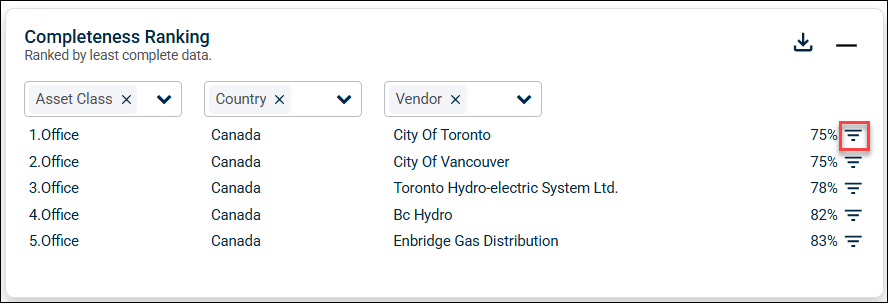
Completeness Ranking
-
Use this section to compare data completeness by Location, Asset Class, Source, etc. Up to 3 data groupings can be selected.
-
Displays ranking by least completed data. A full list of completeness rankings can be downloaded by clicking on the download icon in the top right corner of the card.
-
Click the filter icon on the right side of the Completeness Ranking section to set filtered rankings in the table and view the 12-month rolling forecast on the Data Completeness chart.
NOTE Any filters applied in the ‘Account Detail Table’ will also be applied to the ‘Completeness Ranking’ section. See ‘Table Filters’ section for more details.
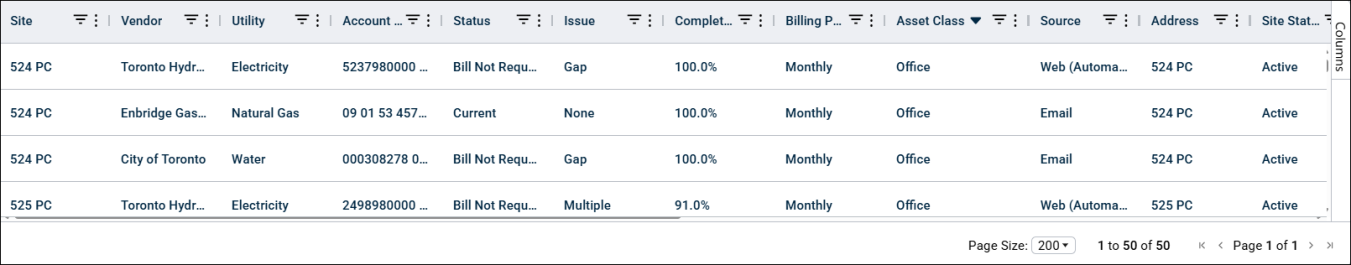
Account Detail Table
Table contains the following columns:
|
Column |
Description |
|
Site |
The name or identifier of the location or facility being monitored for data completeness. |
|
Vendor |
The vendor or service provider responsible for the data or service. Ex. Toronto Hydro |
|
Utility |
The type of utility service associated with the site (such as, electricity, water, etc.). |
|
Account Number |
The unique identifier for the account associated with the site. |
|
Master Account |
The account that controls or oversees the linked sub-accounts. |
|
Status |
The current state or progress of the site’s data (for example, "Current", “Bills Requested”). |
|
Issue |
Any problem or discrepancies related to data completeness for the site (for example, “None”, “Behind”, “Gap” or “Multiple”) |
|
Start |
The start date of the missing or behind period. “N/A” if Issues are “Multiple” or “None.” |
|
End |
The end date of the missing period, or “Present” for behind bills. “N/A” if Issues are “Multiple” or “None” |
|
Completeness |
The percentage of data available vs. expected over the selected timeframe |
|
Billing Period |
The normal duration of the bill (for example, Monthly, Bi-Monthly etc). |
|
Asset Class |
The type of building associated with the site (such as, residential, commercial, etc.). |
|
Source |
The origination points of the data (for example, system, provider, or other source). |
|
Province/State |
The province or state where the site is located. |
|
City |
The city where the site is located. |
|
Service Level |
The Stream service level. I.E. Core, Pro, Enterprise |
|
Contact |
The designated person responsible for communication at the site. |
|
Last Request |
The date of the most recent request made for data or billing information. |
|
Requests |
The number of requests made for data or billing information. |
|
Annually Loaded Data |
To indicated accounts that are loaded one a year for reporting purposes. |
|
Site ID |
Stream’s unique identification code or a number used to identify the site. |
|
Account ID |
The unique identifier for the account. |
-
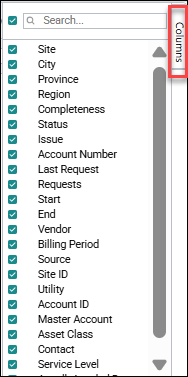
Users can choose which columns to display by checking the boxes in the columns side panel on the right side of the table.
-
Columns can be reordered within the table as needed. These changes, along with any applied filters, will persist even if you navigate to a different Stream page or log back in. This allows you to pick up right where you left off the next time you use Stream.
-
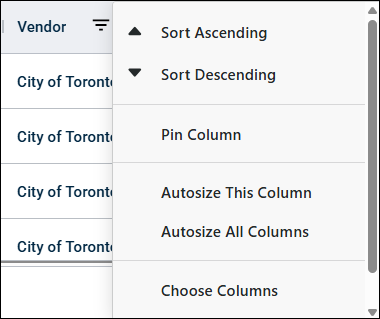
Users can sort columns in ascending or descending order, pin columns, auto size a column, auto size all columns, choose columns, and reset columns.
Data Export
-
Click on the Table to export table information to Excel.
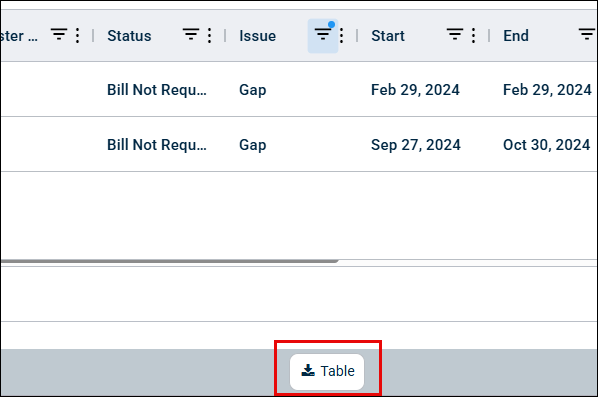
NOTE This export table will have all the data including filtered data.
Table Filter
-
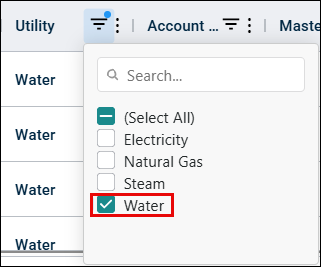
Users can filter by any column as needed. For example, to view a water data, under Utility column, select the Water filter. All data related to water will appear in the table.
-
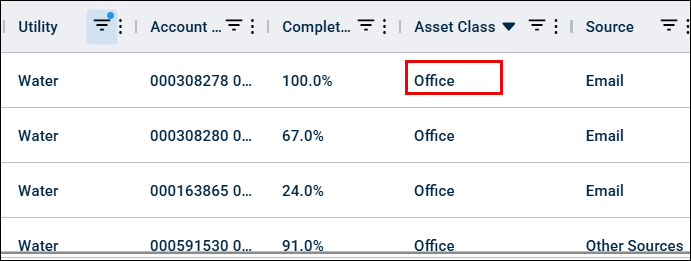
Users can further refine the results by selecting another column filter. For example, under Asset Class, select Office.
-
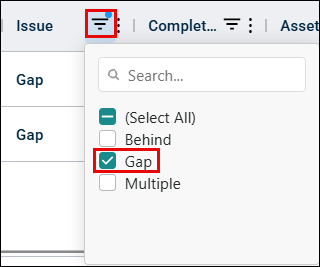
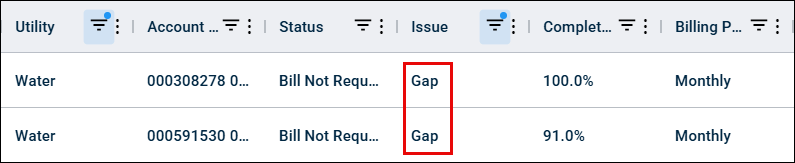
Users can view issues for the filtered data by selecting the Issue filter and checking the required checkbox, such as Gap.
-
Once the user selects the Gap filter, all data related to bill gaps will appear in the table.
NOTE Any filters that are applied to the account data table will also be applied to both the ‘Data Completeness – Monthly Breakdown’ & ‘Completeness Rankings’ sections. All active filters will be shown
at the top of the page.